How can we built a financial network?
The study of correlations between stocks is very useful when trying to understand economy as a complex and dynamic system. Like in many physical systems, we have relations between subsystems and elementary interactions. The interactions that are underneath financial markets are usually unknown. That is why building a network from correlations of prices can help us to extract useful information. Moreover correlations between stocks are very important in the process of portfolio optimization. In this post we will show correlation based trees and networks, obtained from a correlation matrix. In order to do that, we will descirbe two filtering procedures that will help us in detect statistically reliable aspects of these important matrices.
In particular in this work we wanted to see how the 2008 financial crisis affected a network structure. Typically, we consider the daily difference in logarithmic scale of the stock’s value, called return r_i . But we can consider the time resolution that best answers our questions.
We considered a portfolio of N stocks, quoted simultaneously on the market in a time window T. Using the daily fluctuation of prices we evaluated the correlation coefficients between all stocks. These correlations form a matrix of values, that can be translated into a fully connected weighted graph. A fully connected graph is a graph where every node is connected to the others. Here, all the information resides in the weights. In this case the role of algorithms on graph is to extract meaningful weights, that are indeed correlations. We will in fact select a subset of relevant links.
We evaluated the correlation coefficients between the 500 Standard & Poor’s stock market indices, obtaining a symmetric matrix of numbers, -1 ≤ ρ_ij ≤ 1, with 1 on the diagonal.
 We confronted two time windows, respectively called 07 and 09: 1/1/1985 – 6/1/2007 and 1/1/1985 – 12/14/2009, separately for values at opening and closing time. The resulting sets are 4 fully connected weighted graphs, Opening 07 and 09 and Closing 07 and 09. The simple transformation that we performed on this matrix of correlations give us a weighted graph, we just need to define a distance, in order to have non negative numbers 0 ≤ d_ij ≤ 2. Now we have a fully connected graph, where every node has degree N -1.

How can we highlight the strongest correlations in this graph? The well known subgraph that we will extract is the minimum spanning tree. This object is a weighted undirected graph, which connects all the vertices together with the minimal total weighting for its edges. And, of course, it doesn’t have loops. The recursive algorithm that I performed on these matrices is called Prim’s algorithm. There are other algorithms that can find the minimum spanning tree of a graph, even if this graph is disconnected. But our case regards a fully connected graph, so Prim’s algorithm works fine. The result will be the same, no matter what vertex is our first vertex in analysis.

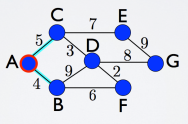
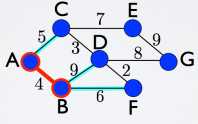
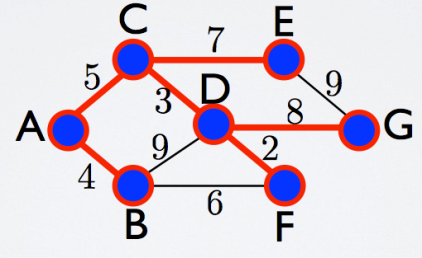
Let’s take a look at this example, a connected graph with some weights. Starting from the vertex A, in red in the picture before, we consider all its links (cyan), we evaluate and we select the one with the smaller number, that is 4. We can move now to the vertex B. We will have to add this vertex to our red selection, and evaluate all the other links, which connect my red part with the remaining vertices. Then again we will choose the smaller weight, that is 5, and select that link and the connected vertex C, and evaluate again which one to choose. The procedure goes on and on until we evaluated all the links and all the vertices are now red and connected to each other. Like in this picture below, where the red selection is the minimum spanning tree of the entire graph.
Another criterion that we used is basically a threshold criterion, we select all the links that correspond to a certain value, and above, of correlation. In this example if we want to select weights of value 5 and below (considering this weight as a distance), we will obtain 3 disconnected parts. Vertices A, B, C, D and F in one cluster and two separate vertices, E and G, which form two more clusters. As we can see, this rough criterion will probably give us disconnected parts, depending significantly on the chosen threshold. On the contrary the minimum spanning tree, by definition, is the spanning tree that connects all the vertices, and we never have disconnected part. Therefore there is something very interesting in this second criterion, which is the possibility of seeing the emergence of clusters, that are vertices highly correlated between each other.
What happened when we performed these filtering procedures on the correlation matrices of our stocks? We will see in the next post our interesting results! Stay tuned.
